
Case study · Colombia
What it cost to start a conversation and what happened on a Bogotá gynecologist’s appointment calendar
If I told you that one campaign generated WhatsApp conversations for COP 1,692 each, would you increase its budget? I’d open the appointment calendar first. A practice manager wants to know what it cost to get someone to write, of course. But on Monday morning, they also need to know how many people have appointments and how many slots the doctor still has available.
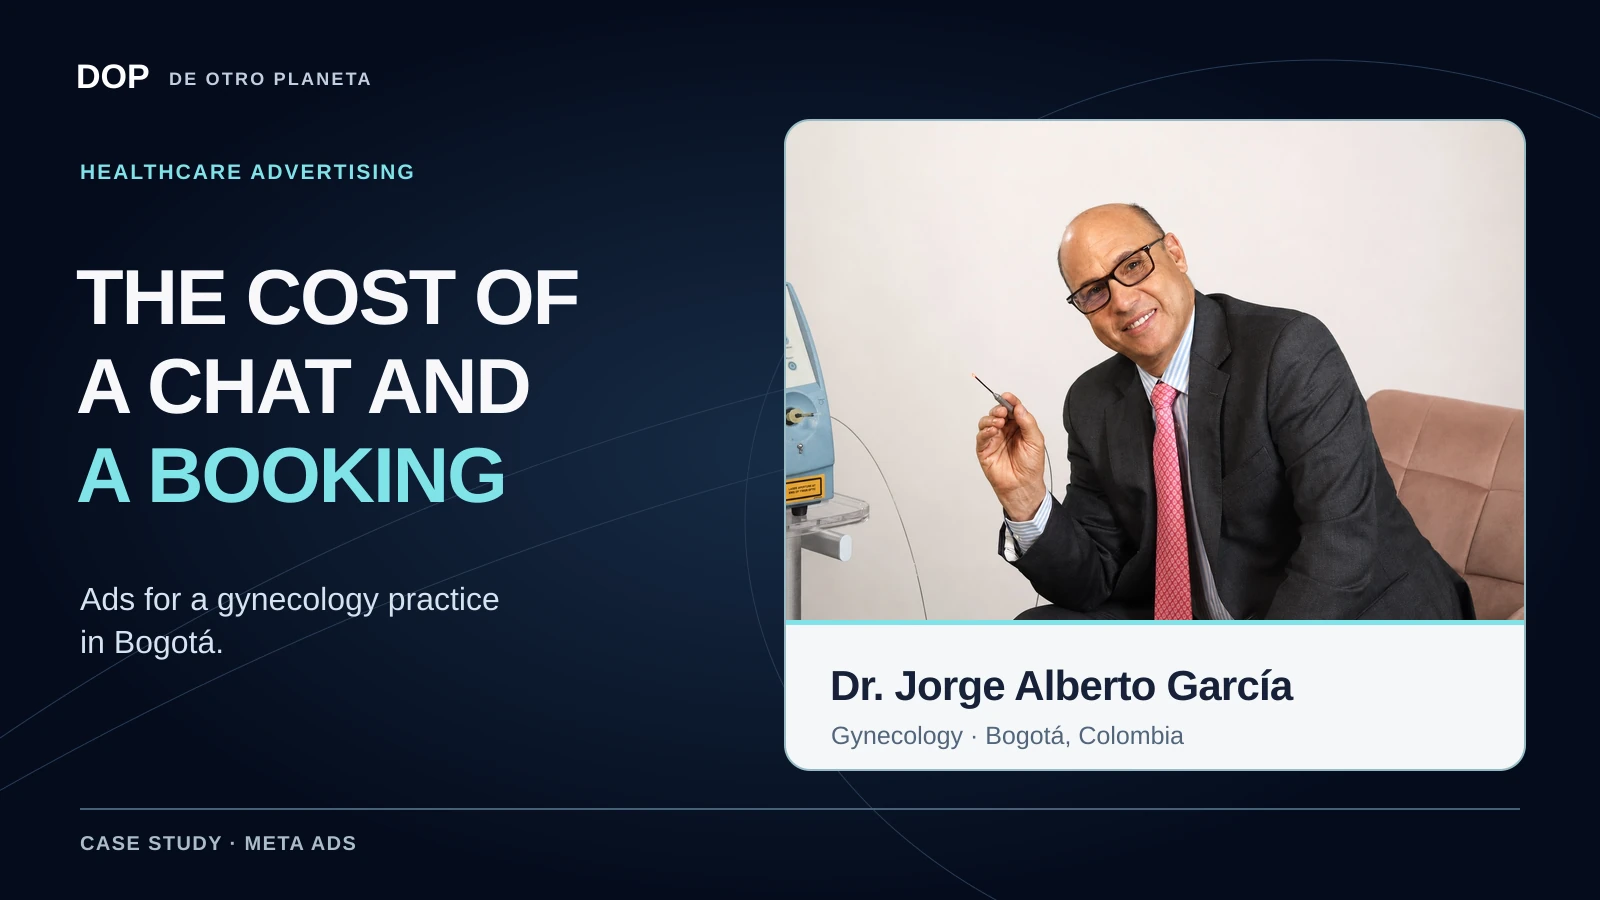
I wanted to answer that question using figures from Dr. Jorge Alberto García, a gynecologist and urogynecologist in Bogotá, Colombia. I used the same period for three sets of records, February 1, 2025 through October 31, 2026. I opened the Meta campaigns, counted appointments with a recorded date, and followed the billing records to see what happened after the consultation.
What I saw when I compared the records
Across six campaigns I could count 31,398 conversations. Over those same 21 months, the practice recorded 1,077 appointments. Side by side, that works out to 3.43 appointments on the calendar for every 100 reported conversations. The way I’d put it to my team is that there was roughly one appointment on the calendar for every 29 conversations visible in those campaigns.
Does that mean I can pick 29 chats at random and find the person who booked? These files don’t let me trace that journey. The calendar includes all channels, and the other campaigns display different results. The comparison helps me gauge how much work the team handles. To calculate the WhatsApp booking rate, I would need the source of each appointment and conversation totals for every campaign.
Why this case is about Bogotá
We worked with a specialist who had more than 30 years of experience and received patients through word of mouth. People can find it hard to ask questions about intimate health in public. We combined educational content and ads addressing specific concerns with a private WhatsApp channel where people could take the next step. The practice is in Bogotá, and some of the advertising also targeted an international audience. That matters when reading the costs.
What we paid per conversation
In Ads Manager, I separated out the six campaigns that reported conversations as their result. Together they spent COP 68,337,424. Dividing that spend by 31,398 conversations gave me COP 2,176 per conversation. I used the spend from those six campaigns because the overall budget also covered awareness campaigns and campaigns with other objectives.
| Messaging campaign | Conversations | Cost per conversation (COP) |
|---|---|---|
| Engagement · Bogotá · May 5 | 12,356 | 1,692 |
| Sales · WhatsApp · September 25 | 8,889 | 2,579 |
| Tightening · Bogotá · January 28 | 5,870 | 1,850 |
| Vaginal Design · Colombia · January 20 | 3,036 | 2,581 |
| Sales · Bogotá · September 18 | 649 | 2,089 |
| Engagement · International · May 5 | 598 | 7,451 |
| Group total and weighted cost | 31,398 | 2,176 |
Two campaigns I would look at together
For the two campaigns dated May 5, an international conversation cost 4.4 times as much as one in the Bogotá campaign. Bogotá also delivered the highest volume. If I wanted more local conversations, I’d start by looking at that campaign. To decide which campaign brought in more patients, I’d need to know which chats led to appointments and what the practice subsequently billed.

During this period, the team marked purchases manually and had not installed Meta’s Conversions API (CAPI). So I used the calendar to count appointments and the practice’s payment records to see what followed.
What I found in the appointment calendar
Of the 1,077 dated appointments, 769 were listed as in person, 306 as virtual, and two had no appointment type recorded. In other words, seven out of ten recorded appointments were in person. If I were planning staff coverage in Bogotá, I’d start by checking how many in-person slots we can offer when someone messages us.
How appointment volume changed across comparable months
I compared February through October in both years, giving me the same nine calendar months in each column. I counted 265 appointments in 2025 and 682 a year later. That’s 417 additional appointments, a 157.4% increase in recorded bookings.
| February through October | 2025 | 2026 |
|---|---|---|
| Appointments with a recorded date | 265 | 682 |
| Average appointments per month | 29.4 | 75.8 |
| Recorded billings (COP) | 425,425,558 | 924,418,666 |
With 29 appointments a month, one person might remember much of the schedule. With close to 76, I’m interested in a different question. When a patient asks for an in-person assessment, can the team offer a time while she’s still in the chat? That’s where message volume turns into a concrete decision about how to run the practice.
How many patients went from consultation to procedure?
In the payment records, I identified 931 patients with at least one billed and dated consultation. I looked for those same people to see who had a procedure billed on the consultation date or later, through the October cutoff. I found 290. Of those 290 patients, 18 had surgery billed.
| Group with a billed consultation | Patients | Percentage of 931 |
|---|---|---|
| At least one billed procedure | 290 | 31.1% |
| Billed surgery, included in the row above | 18 | 1.9% |
Which figure would I use to make a decision?
To plan ads for this practice, I’d use COP 2,176 as the historical cost of starting a conversation across the six measurable campaigns. To estimate capacity, I’d start with the 76 monthly appointments we recorded from February through October 2026. And if the doctor asked what happened after the consultation, I’d show him the 31.1% who had a procedure billed. Each figure informs a different decision.
How far I could follow the same patient
I made a second check. I identified 1,074 distinct people by name in the appointment calendar. I could link 261 of them to a billed consultation on or after their first appointment date. Of those 261, I found 81 with a billed procedure (31.0%) and four with billed surgery (1.5%). This match covered 24.3% of the identifiable names. A record without a match stays unknown. To measure no-shows, I’d need the attendance status of each appointment.
What about the return?
Across the 21 months, Meta recorded total ad spend of COP 187,608,285. The practice recorded COP 1,530,873,013 in billings. For every peso spent on Meta, the practice recorded COP 8.16 in total billings. I also compared the total budget with the entire calendar. Total ad spend worked out to COP 174,195 per recorded appointment, whatever its source. I would use that as a budgeting reference for the practice. To calculate the return attributable to a campaign, I would need to identify revenue from the patients it brought in. Calculating profit also requires knowing the cost of providing the services.
What I would track from the first message
If I were starting a healthcare account tomorrow with this same question, I’d ask the team to do three things. First, save the originating ad when the chat opens. Second, carry an internal ID from WhatsApp into the appointment calendar and update the record to show whether the person attended. Third, link the payment using the same ID. Then I could tell the doctor how much it cost to acquire an attended consultation and which campaign brought in the people who went on to have a procedure.
In the meantime, when a campaign looks expensive, my first question is still the same. What happened on the appointment calendar after those people wrote to us? In Bogotá, we measured the cost of starting a conversation. The next step is following it all the way to the practice.
Case sources: Meta Ads Manager screenshots, the practice’s monthly scheduling and payment records, and its consolidated billing report. Amounts are in COP. Tables show aggregate figures.
Read De Otro Planeta’s case study on Dr. Jorge Alberto García