
Strategy and sales
How to measure your ads: spend, opportunities, sales and profit
An ad can start conversations and a campaign can report conversions. To understand how much the business earned and decide what to keep or change, connect the spend to opportunities, confirmed sales and the costs incurred along the way.
1. Agree on what counts
Before opening a report, define each stage with your team. An inquiry is an incoming contact. An opportunity is an inquiry that meets agreed criteria and has a next step, such as a demo or a quote. A promising conversation becomes a sale when the team has the evidence your business requires.
Use a consistent rule for counting unique people or opportunities. Ten messages in one conversation still represent one contact. Someone may write again or switch channels. Check for that overlap before adding up results.
- Inquiry. A unique contact, with a date and a source marked as known or unknown.
- Opportunity. A contact that meets your business’s criteria. Record why it qualifies and who is handling it.
- Sale. A confirmed order or service, with its identifier, amount and status.
- Return or cancellation. An adjustment linked to the original sale, with its history intact.
2. State the reporting period and cutoff date
If you compare September spend with October sales, explain how they are related. Some opportunities take weeks to close. Counting sales that took place during a month answers one question. Following the contacts acquired that month until a later cutoff answers another.
For a fair comparison, use the same currency, time zone, definition of a sale and refund policy. Note when you pulled the figures, because late sales or adjustments may arrive. If your reporting rule changes, say when it changed and how that affects comparisons.
3. Distinguish recorded source from platform attribution
Recorded source describes how you know where the opportunity came from. Evidence might be a tagged form, a conversation linked to an ad or the customer’s own answer. Keep the source as “unknown” if you have no evidence. A sale happening while a campaign is running is insufficient to credit it to the campaign.
Platform attribution assigns credit according to the platform’s settings and the interactions it can observe. Two platforms may claim the same purchase. Their reports can inform campaign decisions, but the customer still placed a single order.
Reconcile the reports with unique orders or sales records. A transaction ID helps avoid duplicates. Google Ads documents how it detects repeated submissions with the same conversion action and transaction ID. Your team still needs to reconcile duplicates across Meta, Google and its own records.
4. Keep one row per opportunity and one record per sale
A shared spreadsheet can be enough to start. Give someone responsibility for maintaining it and make sure everyone understands the statuses. Record only the details needed for measurement, without copying entire conversations or unnecessary personal data.
Check what each campaign calls a “result.” Clicks, submitted forms and purchases measure different actions. Keep the platform’s reported figures distinct from the outcomes your business can confirm.
- Opportunity. Internal ID, first contact date, source and supporting evidence, owner, status and next step.
- Sale. Order ID, linked opportunity, date, amount, currency and confirmation or payment status.
- Adjustment. Return or cancellation, date, amount and original order.
- Ad spend. Platform, campaign, period and amount spent. Record fees, production and operations separately.
5. A worked example: from ad spend to what the business keeps
This fictional example follows unique contacts received from September 1 through September 30, 2026. We check their sales status on October 15. All amounts are in Colombian pesos and exclude tax. We assume that the opportunities and sales have advertising as their recorded source. That reporting convention cannot establish that advertising alone caused those sales.
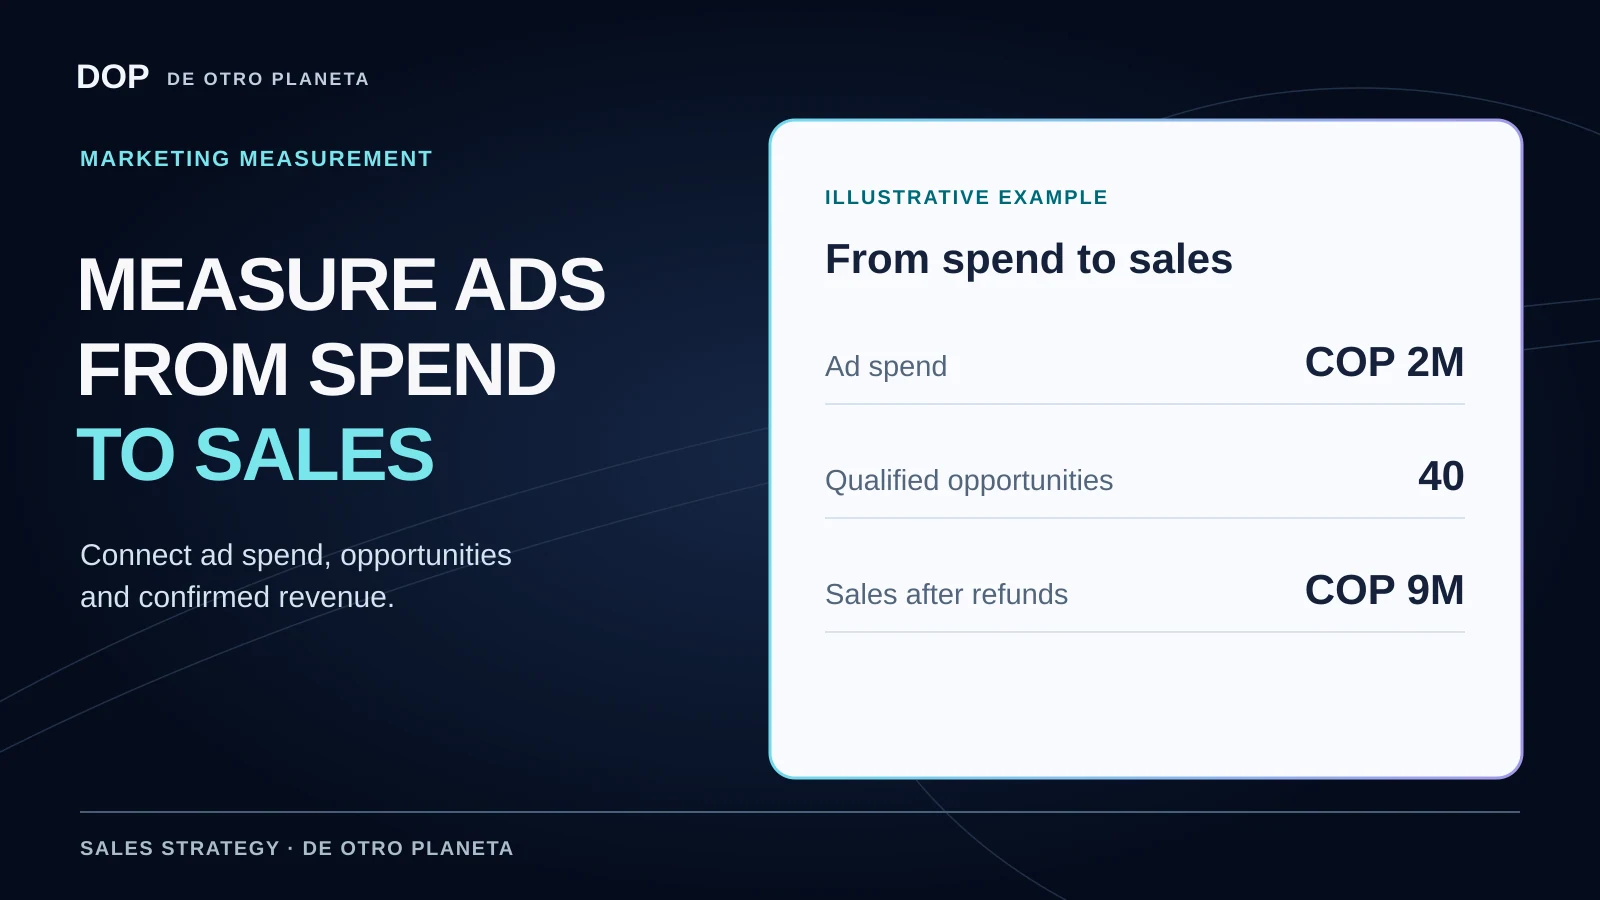
The campaign spent COP 2,000,000 and generated 100 unique inquiries. Forty met the opportunity criteria. By the cutoff, the team had confirmed ten orders worth COP 1,000,000 each. One was refunded in full, leaving nine retained orders and COP 9,000,000 in sales after returns.
| Measure | Value | How to read it |
|---|---|---|
| Ad spend | COP 2,000,000 | September campaign spending. |
| Qualified opportunities | 40 | Unique opportunities meeting the team’s agreed definition. |
| Sales recorded before adjustments | COP 10,000,000 | Ten orders at COP 1,000,000 each. |
| Refund | −COP 1,000,000 | One order refunded in full. |
| Sales after returns | COP 9,000,000 | Nine orders retained by the cutoff date. |
| Cost of the products or services sold | −COP 4,500,000 | Excludes the three expense lines below. |
| Advertising | −COP 2,000,000 | The campaign spend shown above. |
| Fees and production | −COP 800,000 | Recorded separately from media spend. |
| Sales operations | −COP 700,000 | Customer service, tools and operating expenses in this example. |
| Amount remaining in this example | COP 1,000,000 | Before other expenses, taxes or financing costs. |
- Cost per opportunity = COP 2,000,000 ÷ 40 = COP 50,000.
- Return on ad spend under this example’s source rule = COP 9,000,000 ÷ COP 2,000,000 = 4.5×.
- The amount remaining is COP 9,000,000 − 4,500,000 − 2,000,000 − 800,000 − 700,000 = COP 1,000,000. This is a partial balance before other costs and taxes. It cannot serve as a net profit figure or forecast for another business.
6. Read sales alongside costs and returns
Return on ad spend, or ROAS, divides attributed sales value by advertising spend. State whether the sales value is gross, net of returns or calculated on some other basis. ROAS measures a relationship between revenue and ad spend. Business profit requires a separate calculation.
Include the cost of delivering the product or service, fees, production, customer service, commissions, tools and other applicable expenses. Assign each cost to a category so it is counted once. Invoicing, payment and revenue recognition can take place on different dates. Identify the basis for your figures.
A refund can change your reading of a campaign. Google Ads supports adjustments to the value of certain recorded conversions or a retraction, subject to its requirements. After updating an internal sheet, check what adjustment the platform itself needs and keep the supporting record.
7. Use the figures to choose what to improve next
If inquiries are plentiful and few qualify, review the offer and message. If the right opportunities arrive but stall, review service, quotes and follow-up. If sales are coming in but too little is left over, examine margins, costs, returns and delivery capacity before increasing the budget.
Record what you changed, observe a comparable period and consider time to close and sample size. A sales-to-spend ratio alone cannot predict future results.
Our De Otro Planeta cases explain the measurement period and the meaning of “gross return.” Soft Laser shows the relationship between recorded sales and ad spend. Casa di Lucca shows why procurement, returns and operations also matter. These cases describe specific businesses and periods.
Sources and references
STRATEGY · CREATION · SALES
Turn these numbers into a plan for your business
Let’s review your offer, your customer’s journey and the changes that make sense for your team.
See how we connect advertising, customer service and salesTalk to us about your project